
| The cycling of water through the atmosphere is one of the most important fundamental process in nature. Water enters the atmosphere through evaporation from wet surfaces and leaves through condensation, precipitation, and deposition. Water vapor in the atmosphere is invisible to our eyes, but, even without scientific measurements, we know it is there because we see it when it changes phase to liquid or ice and forms dew, clouds, rime, fog, and frost. | |
Writeup Instructions: (29 questions) For this lab, simply answer the questions fully and directly. In your writeup, write each question number followed by the appropriate answer. Do not repeat the question wording in your writeup. Enter your answers under Lab Report 6 in the Submit Labs area. Do NOT email me your answers. I highly recommend that you record your answers using a word processing program, save, and then cut and paste into the answer area.
Purpose: Introduce the concepts of atmospheric water vapor and condensation, practice taking environmental measurements, and learn to derive meteorological variables from measurements.
Background
Humidity refers to water vapor in the atmosphere. There are many different measures of humidity, but for this lab, we will only be using Vapor Pressure, Dew Point, and Relative Humidity. One of the simplest and most widely used measures of water in the atmosphere is vapor pressure (VP). It refers to the atmospheric pressure exerted by water vapor molecules. For example, typically in Hawai'i, this value might be 25 millibars (mb). So, if the overall atmospheric pressure is 1015 mb, then 25 mb is due to water vapor and 990 mb is due to the other atmospheric gases. The amount of water vapor in the air varies from less than 1 mb up to about 70 mb for different places around the globe.
The maximum amount of water vapor that the air can hold is called the saturation vapor pressure (SVP). Saturation vapor pressure varies with temperature: the warmer the air, the more water vapor it can hold. The relationship between SVP and Air Temperature is shown in Table 1 below.
The most widely reported measure of water in the atmosphere is relative humidity (RH). It is also, perhaps, the least understood. The key word is "relative." Vapor pressure tells you how much water is in the air, regardless of air temperature. Relative humidity tells you the ratio of water relative to the maximum amount air can hold (the SVP), which varies with temperature. Another way of stating the relationship is to say that the relative humidity gives you the degree of saturation of the air. Or, relative humidity is the ratio of actual moisture to the maximum possible. Remember, temperature change causes the relative humidity to change because it determines the SVP, but it does not directly cause a change in the vapor pressure (VP).
Finally, the dew point temperature is the temperature at which water condenses from the atmosphere onto surfaces like blades of grass, windshields, or cloud condensation nuclei. At the dew point temperature, the vapor pressure is equal to the saturation vapor pressure and the relative humidity is 100%. The dew point temperature is a measure of the amount of water in the atmosphere, like the vapor pressure. In fact, it is interchangeable with vapor pressure as shown in Table 1 below. Higher dew points indicate more water in the atmosphere.
In this lab you will determine the approximate dew point and relative humidity using simple materials.
Materials needed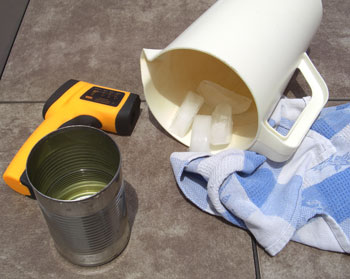
1. tin can with a shiny, clean surface (empty soup can for example)
2. piece of cloth, such as a rag, wash cloth, or dish towel
3. ice cubes
4. water and something to stir it with
5. IR thermometer, reading either °C or °F
NOTE: The IR thermometers were not designed to be very accurate as used in this lab. They are likely to read a bit low, in my experience. No problem, just record whatever the IR thermometer displays, it should be adequate to demonstrate the principles of the lab. In a couple of instances, I will recommend values if your IR measurements are too far off. If you wish, you can calibrate your IR thermometer with an indoor/outdoor thermometer, but that is not required. Just note the difference in readings and add or subtract it to all your IR measurements. But, as noted, calibration is not required.
Abbreviations
RH is Relative Humidity in percent, this is a measure of how saturated with water the air is
VP is vapor pressure in millibars(mb), this is the actual amount of water in the air.
SVP is saturation vapor pressure in millibars (mb), this is the maximum amount of water possible in the air
DP is dew point temperature in °C, this is the temperature at which water condenses from the atmosphere to form dew or cloud droplets
Formula
RH = VP divided by SVP times 100 ( VP / SVP * 100 )
We begin with a little practice using the relative humidity formula, looking up values in Table1, and understanding what is meant by dew point, vapor pressure, and relative humidity.
EXAMPLE TABLE |
||||
Ex. # |
Temperature (°C) |
Saturation Vapor Pressure |
Vapor Pressure |
Relative Humidity |
1 |
20 |
24 |
12 |
50% |
2 |
20 |
24 |
18 |
75% |
3 |
20 |
24 |
24 |
100% |
4 |
14 |
16 |
4 |
25% |
5 |
14 |
16 |
8 |
|
6 |
14 |
12 |
|
|
7 |
30 |
12 |
|
|
8 |
30 |
32 |
|
|
9 |
33 |
|
50% |
|
Look at the completed examples in the table above (Ex. 1 through Ex. 4) and make sure you understand the relationships between climate variables. The Temperature is given. The Saturation Vapor Pressure comes from Table 1 below. The Vapor Pressure (VP) is given in the first 8 examples and calculated in the last. The Relative Humidity is calculated by dividing VP by SVP and multiplying by 100.
1. What is the RH for Ex. 5 in the example table? RH = ______________________ (Hint: use relative humidity formula)
2. What are the SVP and RH for Ex. 6 in the table above? SVP = ________________, RH = ____________________ (Hint: look up SPV in Table 1 below using given temperature)
3. What are the SVP and RH for Ex. 7 in the table above? SVP = ________________, RH = ____________________ (Hint: same as above)
4. What are the SVP and RH for Ex. 8 in the table above? SVP = ________________, RH = ____________________ (Hint: same as above)
5. What are the SVP and VP for Ex. 9 in the table above? SVP = ________________, VP = ____________________ (Hint: look up SVP in Table 1 first, then solve for VP)
6. For Ex.# 8 in the table above, what is the Dew Point Temperature? Dew Pt. Temp. = ______________________ (Hint: use the VP from Ex. # 8 to estimate corresponding Dew Pt. Temp. in Table 1 below)
If you have difficulty, please post questions on the discussion board and another student or myself will help. You need to understand these relationships for the rest of the lab to make sense.
For this lab, you do NOT need a sunny day. In fact, I recommend that you take your measurements in a shaded place.
Record the location, time, date, and sky conditions and estimate the air temperature in the same manner at the sunlight lab.
7. Location ____________________________
8. Time ______________ Date _______________ Sky Conditions __________________
9. Air Temperature ________________ (IR thermometer about an inch from a shaded tree trunk at head height, same procedure as in the sunlight lab)
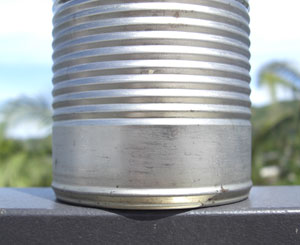
For this exercise, you will use water and ice to determine the temperature that condensation (dew) forms on a tin can. This point is the dew point temperature.
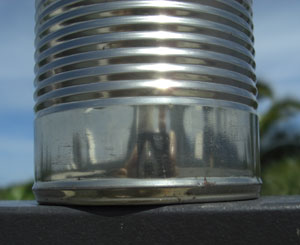 |
 |
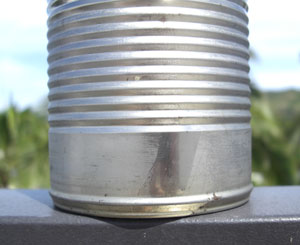 |
Dry can 1/2 full of water |
Dew formation after adding ice |
Trail left by finger in dew |
10. Dew Point Temperature __________________________________
You can calculate quite a few properties of the air if you know the dew point. We will calculate the amount of water in the air (vapor pressure) and the relative humidity. We are going to calculate the relative humidity using the formula given above of RH = VP / SVP * 100, so we need to find out the VP and SVP.
Find the VP using the dew point temperature from #10 above and Table 1 below. Find the dew point temperature in the left hand column and read the corresponding VP in the right hand column.
11. Vapor Pressure (VP) using ice measurements ___________________ (Using #10 and Table 1)
Now find the SVP using the air temperature that you measured in #9 above and Table 1 below. Find the air temperature in the left hand column and read the SVP in the right hand column. Notice that you are using the same pairs of numbers in Table 1 to find both the VP and SVP, in other words, Table 1 works for both the DP to VP relationship and the Air Temp to SVP relationship.
12. Saturation Vapor Pressure (SVP) using air temperature (#9) ______________________ (From Table 1 below)
Now calculate the Relative Humidity using RH = VP / SVP * 100
13. Relative Humidity _______________________ (VP from #11, SVP from #12, SHOW your complete formula and solution!)
A common method of determining the relative humidity of the air is to compare measurements of the air temperature, called dry bulb temperature, with measurements of a wet surface exposed to wind, called wet bulb temperature, using a psychrometer. The principle is that evaporation from the wet area absorbs energy and cools the surface. The lower the relative humidity the air, the greater the evaporation, the greater the cooling, and hence, the lower the wet bulb temperature. This is all calibrated in a table which we will use to determine the relative humidity. Since we have already measured the dry bulb air temperature in #9 above, all we need to do is measure the wet bulb temperature. Instead of using a psychrometer, we are going to improvise with a damp cloth, like a rag, dish towel, or hand towel.
14. Web Bulb Temperature ______________________
Now calculate what is called the wet bulb depression, which is simply the dry bulb temperature (#9) minus the wet bulb temperature (#14)
15. Wet Bulb Depression = __________________________ (dry bulb temp. #9 minus wet bulb temp. #14)
Now use the air (dry bulb) temperature from #9 above and the wet bulb depression from #15 to determine the Relative Humidity from Table 2 below. Notice that you will have to extrapolate and make your best estimate of the Relative Humidity because not all temperature values are shown in the table. Your answer will be close enough. If you wish to use one of the many humidity calculators or tables on the internet, that would be fine.
16. Relative Humidity ______________________________ (from Table 2)
17. When do you think relative humidity is higher, daytime or nighttime? ____________________________ (Guessing is fine)
18. Assume that the nighttime temperature is 8 °C (14 °F) cooler than the daytime temperature you measured in #9 above. What is the nighttime temperature? _________________________ (subtract either 8 °C or 14 °F from the air temperature you measured in #9)
19. What is the nighttime SVP? _____________________________ (from #18 temperature and Table 1 below)
20. Assume that the VP is the same both day and night. Using the VP from #11 and the nighttime SVP from #19, what is the relative humidity at night? ___________________
21. What were the daytime and nighttime relative humidities? Day (#13) _______________________ Night (#20) __________________
22. What was higher, daytime or nightime RH? ___________________________ Was your assumption in #17 correct? __________________________
23. Dew forms when the relative humidity reaches 100%. When is dew most likely to form, daytime or nighttime? ________________ (Hint: which had the highest relative humidity?)
24. Based on your nightime RH calculations, do you think that the relative humidity in a cold, air conditioned room would be higher or lower than the relative humidity outside on a hot day, assuming that the VP was the same both inside and outside ? _______________ Explain _________________________________________
25. As noted in the background discussion, the daily temperature change has very little effect on the vapor pressure of the air. The amount of water in the atmosphere (VP) only changes when water is added or removed from the air. Think of two ways that water vapor could be added to or removed from the air. (do NOT say temperature change).
The amount of water vapor in the air would INCREASE if _________________________________________.
The amount of water vapor in the air would DECREASE if _________________________________________.
26. Go to the NOAA Honolulu Weather site at http://www.prh.noaa.gov/hnl/ . In the menu at the left, under Current Conditions, click Observations. Under Sites Across Hawaii, click on the XML button for the weather station nearest you. What is the Dew Point Temperature given? __________________________________
27. By how many degrees higher or lower was #26 compared to the Dew Point Temperature (#10) that you measured with the ice experiment? ________________ Note: Do NOT change your own measured numbers, I am not grading you on how close you are to the real dew point, I want to you conduct the experiment and then check to compare values. Also, as noted above, the IR thermometers might error a few degrees as used in this lab.
28. Based on your comparison of Dew Point Temperatures with the NOAA site, which of your calculated relative humidity values (#13 and #16) do you think is the most accurate, the ice experiment or the wet towel experiment? ___________________________ Explain _________________________________.
29. Please tell me about how long it took you to complete this lab and what significant problems you had. Thanks.
Table 1 (°C) |
Table 1 (°F) |
|||
|
Dew Pt. or Air Temp. |
VP or SVP (mb) |
Dew Pt. or Air Temp. |
VP or SVP (mb) |
|
0 |
6.1 |
26 |
4.8 |
|
1 |
6.6 |
28 |
5.2 |
|
2 |
7.1 |
30 |
5.6 |
|
3 |
7.6 |
32 |
6.1 |
|
4 |
8.1 |
34 |
6.6 |
|
5 |
8.7 |
36 |
7.2 |
|
6 |
9.4 |
38 |
7.8 |
|
7 |
10.0 |
40 |
8.4 |
|
8 |
10.7 |
42 |
9.1 |
|
9 |
11.5 |
44 |
9.8 |
|
10 |
12.3 |
46 |
10.6 |
|
11 |
13.1 |
48 |
11.4 |
|
12 |
14.0 |
50 |
12.3 |
|
13 |
15.0 |
52 |
13.2 |
|
14 |
16.0 |
54 |
14.2 |
|
15 |
17.0 |
56 |
15.3 |
|
16 |
18.2 |
58 |
16.4 |
|
17 |
19.4 |
60 |
17.7 |
|
18 |
20.6 |
62 |
19.0 |
|
19 |
22.0 |
64 |
20.3 |
|
20 |
23.4 |
66 |
21.8 |
|
21 |
24.9 |
68 |
23.0 |
|
22 |
26.4 |
70 |
25.0 |
|
23 |
28.1 |
72 |
26.8 |
|
24 |
29.8 |
74 |
28.7 |
|
25 |
31.7 |
76 |
30.6 |
|
26 |
33.6 |
78 |
32.7 |
|
27 |
35.6 |
80 |
34.9 |
|
28 |
37.8 |
82 |
37.3 |
|
29 |
40.1 |
84 |
39.8 |
|
30 |
42.4 |
86 |
42.4 |
|
31 |
44.9 |
88 |
45.2 |
|
32 |
47.6 |
90 |
48.2 |
|
33 |
50.3 |
92 |
51.2 |
|
Table 2: Relative Humidity Tables for °C and °F
11 12 13 91 83 74 66 59 51 44 37 31 24 18 12 6 92 83 76 68 61 54 47 40 34 28 22 17 11 92 84 77 69 62 56 49 43 37 31 26 20 15 92 85 78 71 64 58 51 46 40 34 29 24 19 93 85 78 72 65 59 53 48 42 37 32 27 22 93 86 79 73 67 61 55 50 44 39 35 30 25 93 86 80 74 68 62 57 51 46 41 37 32 28 93 87 81 75 69 63 58 53 48 43 39 35 30
Air Temp. ( °F ) |
Wet Bulb Depression ( °F ) |
|||||||||||||||||||
1 |
2 |
3 |
4 |
5 |
6 |
7 |
8 |
9 |
10 |
11 |
12 |
13 |
14 |
15 |
16 | 17 | 18 | 19 | 20 | |
75 |
96 | 91 | 86 | 82 | 78 | 74 | 70 | 66 | 62 | 58 | 54 | 51 | 47 | 44 | 40 | 37 | 34 | 30 | 27 | 24 |
80 |
96 | 91 | 87 | 83 | 79 | 75 | 72 | 68 | 64 | 61 | 57 | 54 | 50 | 47 | 44 | 41 | 38 | 35 | 32 | 29 |
85 |
96 | 92 | 88 | 84 | 80 | 77 | 73 | 70 | 66 | 63 | 60 | 56 | 53 | 50 | 47 | 44 | 41 | 38 | 36 | 33 |
90 |
96 | 92 | 89 | 85 | 81 | 78 | 74 | 71 | 68 | 65 | 61 | 58 | 55 | 52 | 49 | 47 | 44 | 41 | 39 | 36 |