Isoline Maps
Geography 101 Lab
Purpose: Introduce students to one of the most common and useful types
of maps used in studying the natural environment. When completed, the student
should understand the basic meaning of isolines maps, how to construct them
and how to derive information from them.
Many surfaces in nature are represented with isolines. They provide a method
of representing 3-Dimensional surfaces on 2-Dimensional maps. An isoline is
simply a generic term for any line on a map that connects points of equal value.
Some
examples of isolines are:
| Name |
Connects Equal Values of |
| Contour |
Elevation |
| Isohyet |
Rainfall |
| Isobar |
Air Pressure |
| Isotach |
Wind Speed |
| Isohaline |
Salinity |
| Isoseismal |
Earthquake Intensity |
| Isoflor |
Number of Plant Species |
Part 1: Basic Rules
Some basic rules regarding isoline (and isopleth) maps are:
- isolines connect points of equal value
- isolines do not cross or touch (with the exception of vertical gradients, like cliffs)
- the interval is the numerical difference between adjacent isolines and is usually the same over the entire map
- isolines pass between higher and lower values
- isolines show gradients, defined as the amount of change over distance. Isolines close together show a high gradient, isolines far apart represent a low gradient.
- in nature, gradients usually indicate a flow from the higher values toward the lower values (for example, air moving from high pressure to low pressure and heat moving from areas of high temperature to areas of low temperature). Higher gradients usually indicate faster flow, e.g. high pressure gradients cause high wind speeds.
- isoline maps show elements that vary continuously over an area, rather than point values, categories, or uniform areas.
The map below is an isoline map showing isobars (in millibars) for the area
Hawaiian Islands area. Isobar maps are useful in weather forecasts. After reading the information above, answer the following
sample questions regarding the isobaric map:
|
Sample Questions:
- Isobars show equal values of what?
- Do any isobars touch or overlap?
- What is the pressure interval in millibars between isobars on this map?
- What is the pressure at point A?
- What is the difference in pressure between B and A?
- Where is the highest pressure located?
- Estimate the pressure at point C.
- Estimate the pressure at point D.
- What direction will air flow, from B to A or from A to B?
- Name three other environmental variables not mentioned in this lab
exercise or listed above that could be mapped using isolines.
|
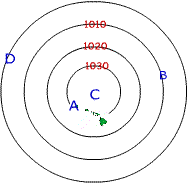
Figure 1: Isobar Map |
Part 2: Drawing and Interpreting Isolines
Isoline maps show patterns in an easily recognizable way. Usually they are
constructed from scattered observations that are difficult to
interpret. The mapmaker (or the computer) must convert these isolated observations
into a complete isoline map by interpolating between observed values and then
connecting points of equal value. The resulting isoline map gives a much
clearer view of the pattern.
Consider the map to the right showing isohyets
of annual rainfall over East Maui in millimeters (2000, 3000, etc.).
The numbers beside the black dots are observed rainfall amounts measured
at various stations. The BLUE isohyets have been interpolated based on the rainfall station values and are all correct. The RED isohyets may or may not be correct.
Notice how the BLUE isohyets pass between observations of higher and
lower value. The 2000 mm isohyet, for example, passes between the 2345
mm and 1799 mm stations just north of Hana and the 6000 mm isohyet passes
between the 5920 mm and 6231 mm stations further inland. For points that are between isohyets or point values, you can estimate rainfall amounts. A point halfway between the 4000 and 5000 mm isohyets, for example, would receive about 4500 mm rainfall per year on average. A point halfway between the 2200 and 2840 mm stations would receive about 2520 mm rainfall per year.
Sample Questions:
Using Figure 2: Intrepreting Isolines at the right:
11. What is the approximate rainfall value at A based on the BLUE isohyets?
12. What is the approximate rainfall value at B based on the BLUE isohyets?
13. What is the approximate rainfall value at C based on the BLUE isohyets?
14. What is the approximate rainfall value at D based on nearby station values?
15. What is the approximate rainfall value at E based on nearby station values?
Use Figure 2 and the Basic Rules from Part 1 above to answer the following questions:
16. Is there anything wrong with line F? If so, what?
17. Is there anything wrong with line G? If so, what?
18. Is there anything wrong with line H? If so, what?
19. Is there anything wrong with line I? If so, what?
20. Is there anything wrong with line J? If so, what?
|

Figure 2: Interpreting Isolines |
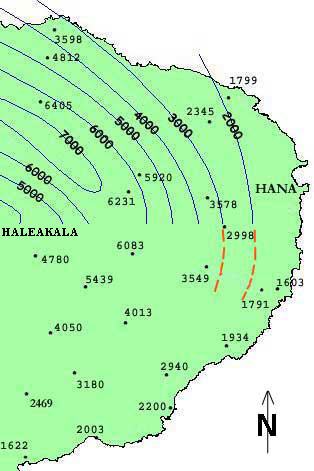
Figure 3: Drawing Isolines |
In Figure 2 above, some of the RED isohyets are wrong. Try to draw the isohyets for the bottom half of the map correctly. Remember,
each isoline must pass between observations with higher and lower values,
never between two lower values or between two higher values. For example, the 5000 mm isohyet will pass between the stations with 5439 and 4013 mm of rainfall. The 2000 mm isohyet with pass between the stations with 1622 and 2469 mm rainfall. And so on. Your completed map should look like a thumbprint.
Click for a printable map.
Sample Questions:
Look at your completed map.
21. Does rainfall tend to increase or decrease as you move inland (west) from Hana?
22. Starting from the bottom of the map at the rainfall value of 1622, does rainfall increase or decrease as you move directly northward?
23. The mountain name label "Haleakala" is located at the highest point in this map. On your completed map, where are the highest rainfall amounts located? The highest elevation? Lowest elevation? Intermediate elevation? North, south, or east of the highest point?
24. Where are the lowest rainfall amounts, near the coast or inland?
|
Part 3: Gradient and Profile
Isolines show surfaces whose values differ with location. Is there is no change,
there would be no isolines. Therefore, there is always a gradient on an isoline
map; for example from high to low pressure, high to low elevation, high
to low concentration of a pollutant, high to low density of termites, and so
on.
The distance between isolines shows the amount of the
gradient. Very close together means a steep gradient, and far apart means a
gradual gradient. This can
be quite
meaningful.
In hurricanes, the isobars are very close together and so the air pressure
gradient is said to be high, or steep. This drives strong winds. We will look
at gradient
and profile using the example of contour maps, also called topographic maps,
which are isoline maps showing surface elevation.
|

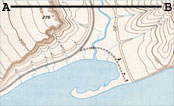
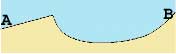
Figure 4: Reading Contour Maps
|
The image to the left shows a perspective view of a river mouth at the
head of a valley between a steep cliff (to the left) and a smoother
slope (to the right).
The rendition of this topography as an isoline (contour) map from an
overhead perspective is shown directly below.
Notice that the contours (isolines) are very close together where they
represent the steep cliff and further apart in the flatter river valley.
This property of isolines maps is referred to as the gradient, or the amount change over distance. In the case of contour maps, the gradient refers to the change in elevation over distance, which is very high for the cliff area and very
low for the river valley. In practical terms, a high elevation gradient
on a contour map refers to steep slopes and a low elevation gradient
refers to flatter terrain. Gradient on other types of isoline maps can be interpreted similarly. A high pressure gradient on an isobar map indicates a high pressure gradient force and strong winds, while a low pressure gradient suggests light winds.
Profile refers to a cross-section, or horizontal view, of some
part of the isoline map. For example, if I walked from A to B on the map,
my path would look like the drawing at the bottom. First I walk up a gradual
slope, then down a cliff, then across a flat river valley, then up slope
that becomes increasingly steep..
|
Below is a topographic map of the area above Makawao, Maui, showing isolines
of elevation called contour lines. Using the information given in the explanation
above, try to answer the sample questions. If you get confused, I recommend doing an internet search with keywords "how to use topographic maps." You should come up with a list of several useful sites.
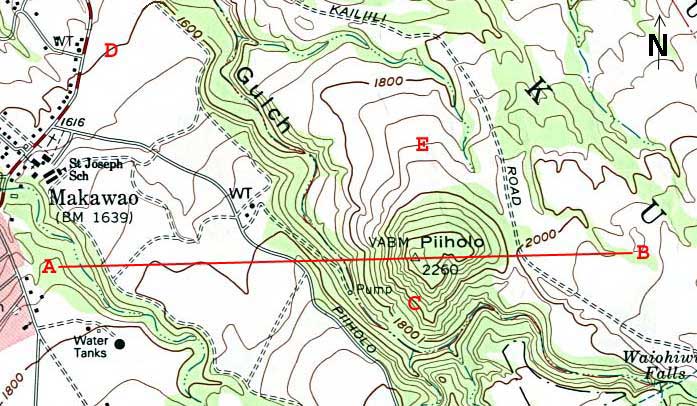 |
Figure 5: Interpreting Contour Maps |
Sample Questions:
25. The height interval between contour lines is 40 feet. Explain how to calculate this value using information given on the map.
26. What (in feet) is the highest elevation point on the map and what is its name?
27. What is the elevation at point D?
28. What is the elevation at point C?
29. What is the elevation at point E?
30. From point C, which direction is downhill (NE, NW,S E, or SW)?
31. Which point lies on the highest elevation gradient, C, D, or E?
32. In your own words, what is physically meant by "highest elevation gradient?"
33. Which point lies on the lowest elevation gradient, C, D, or E?
34. In your own words, what is physically meant by "lowest elevation gradient?"
35. If you walk from A to B, what is the lowest elevation you would reach?
36. If you walk from A to B, what is the highest elevation you would reach?
37. On a piece of paper, draw an approximate profile of your journey from point A
to point B. Show where you go uphill and downhill and cross relatively flat areas.
38. Topographic maps show many features besides just elevation contour lines.
Look at the map of the Makawao area and name four other features it shows the location
of.
A perspective image of the path from A to B taken from Google Earth is shown below in Figure 6 (courtesy of Prof. Toshi Ikagawa). Compare this image to Figure 5 above. If you walked from A to B:
39. Do you cross through any developed areas with housing?
40. Primarily what type of land use would you walk through?
41. How many times would you cross a road? (compare with Figure 5)
42. How many small stream valleys would you cross through? (shown as the dark sinuous patches in the image, compare with Figure 5)
43. What direction would you be walking? (N, S, E, or W)
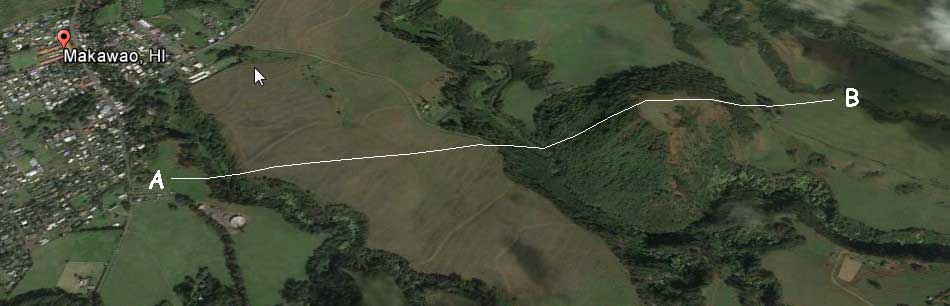 |
Figure 6: Perspective Image of Path A - B |