THE NATURAL ENVIRONMENT
Geography 101
ToC
SKY
Origin
Air
Layers
Sunlight
Scatter
Refract
Hawai'i
Hawai'i Solar Radiation
So far in this chapter, we have covered quite a bit of physical background, but very little actual geographic location. We will conclude with a look at the distribution of solar radiation in Hawai'i.
History
 It turns
out that mapping of sunlight in the Hawaiian
Islands has a long history.
At one time, Hawai'i had what was probably the densest solar radiation
monitoring network in the world. This came about for several reasons:
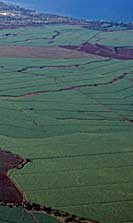
- Sugar Industry. Several studies showed a direct correlation between sunlight exposure and sugar cane growth (more is better), prompting the sugar growers to install monitoring equipment in an attempt to model yields.
- Climate Gradients. Because the climate gradients are so steep in the Islands (i.e. sunny and cloudy areas are close together), many sensors needed to be maintained to accurately measure the solar radiation distribution.
- Research. The Hawai'i Sugar Growers Association (HSPA) and the University of Hawai'i collaborated on major research programs in the mid to late 20th century, meaning that money, opportunity, and expertise were available.
- Energy Crisis: When the price of gas shot up at the close of the 1970's, the federal government began funding alternative energy studies. In Hawai'i, this led to establishing very high quality measurements at several sites in the Islands to evaluate solar energy potential.
|
|
BOX 1 |
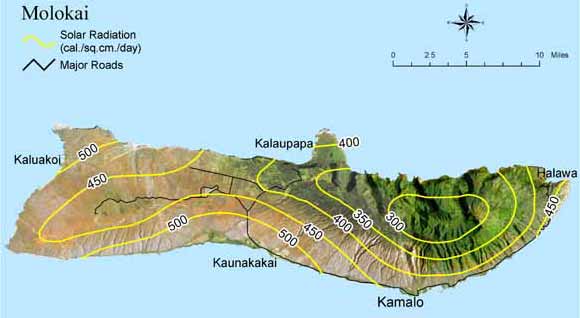
Today sugar cane is gone, but the sunshine data remains. Several different groups have compiled the data into sunlight energy maps of the Islands for various purposes. The State of Hawai'i Department of Business and Economic Development developed the maps below to aid in designing of solar hot water systems.
Solar Radiation Distribution
The amount of sunlight energy reaching the surface varies greatly from place to place in Hawai'i. The sunlight pattern basically matches the cloudiness pattern, thus mountains generally receive less total solar energy than coastal areas, especially on leeward shores. The Moloka'i sunlight energy map below shows the basic pattern common on all of the larger Islands with total annual solar energy ranging from an average of less than 300 cal./sq. cm/day in the central mountains to more than 500 cal./sq. cm/day along the leeward coasts. Another major feature seen on the Big Island and Maui maps is the very high sunlight exposure in the highest mountains. Above about 2100 meters (7000 feet), skies are generally cloud free and sunlight scatters less in the thinner atmosphere. Because scattering is much lower at high elevations, the shortest wavelengths in sunlight, including ultraviolet light, can be quite intense and can cause serious skin damage fairly quickly.
The maps show sunlight in energy units of cal./sq. cm/day averaged over an entire year. Values in winter are typically about two thirds (2/3) those of summer time, because of fewer daylight hours and lower sun angle.
