THE NATURAL ENVIRONMENT
Geography 101
ToC
HEAT
Albedo
Greenhouse
Balance
Global
Local
Global Temperature
 Air
temperature is one of the most basic climate elements. It is reported
in just about every corner of the world and is fundamental to human
comfort, or discomfort. For standard air temperature measurements, instruments
are housed in an enclosure, such as the ubiquitous Stevenson screen seen
at the right, to shield the sensor from sunlight, with the
thermometer placed at about head height. If it were
located at a different height, such as at ground level, maximum and minimum temperatures
would be different, but the daily and monthly averages would be about the same.
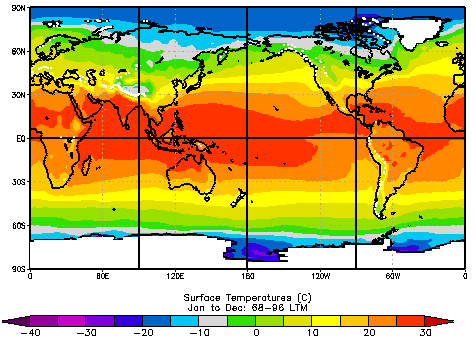
Temperature readings from different places are compiled into full-coverge thematic maps, as shown in the global temperature map below. On the map, lines of equal temperature are called isotherms; analogous to lines of equal atmospheric pressure being called isobars, or lines of equal rainfall called isohyets.
|
|
BOX 1 |
Major differences in air temperature from place to place depend on the local energy balance and proximity to large bodies of water.
Energy Balance Variation
On a global scale, sunlight energy causes most variation in temperature between places. Annual differences in sunlight due to Earth's orbit around the sun produce seasonal changes and latitude differences explain the north-south pattern obvious in global temperature maps.
Seasonally, sunlight intensity changes in a predictable way. Simply put, a place receives maximum sunlight energy at its summer solstice when the daylight hours are longest and the sun's rays most perpendicular to the ground. Compare the solar beam angles between the Northern and Southern Hemisphere in the December Solstice diagram for example; on average, angles are much more vertical in the Southern Hemisphere. Sunlight energy is more concentrated when the sun is higher in the sky producing more surface heating. The pattern flip-flops at June solstice, when the Northern Hemisphere experiences its highest sun angles and surface temperatures.
 The
angle of sunlight to the surface also depends on latitude. In general, at higher latitudes the sun is lower on the horizon weakening sunlight intensity and producing cooler temperatures.
Global Temperature Map
The change of sunlight intensity with latitude determines the most obvious pattern in annual temperature maps: tropics are warm and high latitudes cool. This should seem familiar as we discussed the same topic in the previous section under Planetary Energy Balance. Compare the diagram from that section with the map below. They are different ways of looking at the same phenomenon, with the Planetary Energy Balance showing why polar areas are cold and tropics warm, and the map below showing the actual temperature distribution.
The air temperature map gives much more detail, however, as it shows the entire Earth surface. Remember the solar hot water heater analogy used to explain heat transfer in the Balance section? Look at the South Pacific Ocean between Australia and South America. On the Australia side warmer water flows poleward, while on the South America side, cooler water moves north toward the equator. The South Pacific has a huge circular ocean current that sends warm water to higher latitudes on the Australia side and returns cold water to be re-heated in the tropics on the South America side. The net result is a transfer of heat from tropical areas to polar areas through ocean currents.
Also notice that the temperature change between equator and Poles is fairly uniform over the oceans, but varies widely over the continents. The reason for this is discussed below.

Effect of Water Bodies
Large bodies of water hold enormous amounts of heat, much more than land surfaces. With a very high heat capacity, ocean surfaces heat and cool slowly, while land surfaces heat and cool much more quickly. As a result, air temperatures over or near oceans or large lakes remains fairly stable, while inland areas tend to have large temperature ranges. (Range refers to the temperature difference between the warmest and coldest months.) This stabilizing affect can be see at all time scales, from annual temperature ranges to the daily temperature cycle.
 The
average annual temperature range of the ocean surface around the Hawaiian Islands,
for
example is about 3°C (5° F), varying from about 26° C in summer to 23° C in winter. In contrast, the central Sahara Desert, at the same latitude as the Hawaiian Islands, has
an average
annual
temperature range of over 12° C (20° F). Places where temperature is greatly moderated (meaning
that extreme temperatures are uncommon) by nearby water
are said to have a marine climate, while areas far from
water influence (where temperature extremes are more likely) are said
to have a continental
climate.
In addition to the effect on temperature, marine climates are typically humid because evaporation from the ocean surface adds water to the air and continental
climates are typically dry because they lack substantial sources for atmospheric water vapor.
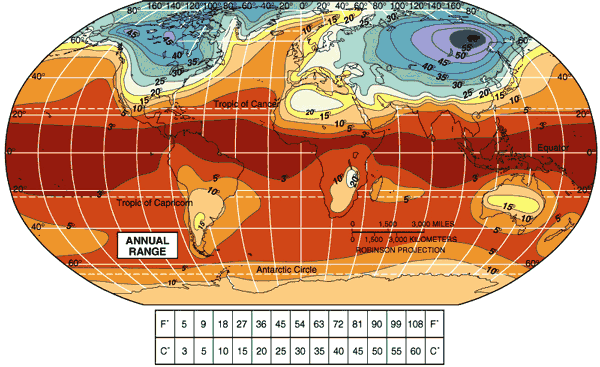
 The
difference between marine and continental climates is most obvious in
a world map showing the average annual temperature range. Notice how quickly the marine
climate
influence weakens as you move inland over the major continental areas
outside of the tropics.
Also note that the annual temperature varies little in the tropics (always warm) and polar areas (always cold) but a great deal in the midlatitudes, which is the region of heat transfer from the tropics to polar latitudes. In the midlatitude zone, temperatures can vary quickly and widely to produce Earth's most chaotic weather.
Average Annual Temperature Range (°C)
