
THE NATURAL ENVIRONMENT
Geography 101
ToC
WIND
Forces
Motion
Global
Local
Wind Forces
When weather analysts prepare daily charts that show wind and weather systems, they begin with an isobaric map. Isobars, the curved black lines in the image, show lines of equal pressure and when drawn over a large area, such as the Pacific Ocean, they give a coherent view of the surface weather. A typical weather chart shows pressure patterns, wind speed and direction, locations of fronts, locations of pressure systems and their motion, cloud cover, and more, as shown in the sample chart below. If you stripped away the colored information on the map, the most fundamental element in weather analysis would remain: the black isobars.

|
|
BOX 1 |
If you look at the isobars, you see that they never overlap and that almost all of them have adjacent isobars that are either higher or lower. Look at the Hawaiian Islands area, for example. On the chart, Hawai'i lies between the 1020 and 1016 millibar (mb) isobars. That's a bit higher than the average pressure of 1015 mb for Honolulu. Also note the range of pressures over the north Pacific, from 1035 mb at the center of the High north of Hawai'i, to 997 mb at the center of the Low in the Western Pacific.
Pressure Gradient Force
The difference in pressure between the isobars produces a force that sets air in motion called the Pressure Gradient Force, or PGF. Gradient refers to the change in pressure with distance. Look at the Hawaiian Islands area again. The pressure difference between 1020 and 1016 isobars is 4 mb and they are separated by about 600 kilometers (370 miles). The PGF on that day, therefore, was 4 mb per 600 km or about 0.007 mb/km, a normal trade wind condition.
The PGF sets air in motion and determines wind speed. The higher the pressure gradient, the higher the wind speed as shown in the diagram below. In the diagram's left panel, the total pressure change is 8 mb (1020 - 1012 mb), causing relatively light winds. Over the same distance in the right panel, the pressure difference is twice as great, 16 mb (1020 - 1004 mb), causing correspondingly higher wind speed. So, PGF is the driving force behind wind and the closer the isobars are together, the stronger the wind.
 |
 |
Coriolis
 The
constant rotation of planet Earth on its axis affects the direction of
wind. In the Northern Hemisphere, relative to the
surface, moving air will deflect to the right. In
the Southern
Hemisphere, wind will deflect to the left.
This deflection is called the Coriolis Force,
illustrated in the diagram.
The
constant rotation of planet Earth on its axis affects the direction of
wind. In the Northern Hemisphere, relative to the
surface, moving air will deflect to the right. In
the Southern
Hemisphere, wind will deflect to the left.
This deflection is called the Coriolis Force,
illustrated in the diagram.
Coriolis affects not only moving air, but any mass traveling over a significant distance including ocean currents. For example, if you shot a missile from the North Pole directly south toward the equator, it would curve right and begin to drift westward as shown in the diagram. If you shot your missile from the equator directly north, it would also curve right and begin to drift eastward. Try sketching this scenario on paper to visualize the Coriolis deflection. If you were at 30° north latitude and shot a missile westward, which direction would it drift? Toward the equator or the pole? How about the same scenario for 30° south?
Confused? It would be easier for meteorologists and for students if our planet was more like Venus which has virtually no rotation and thus, no Coriolis effect. Just remember, Coriolis deflects moving air to the right of the direction of motion in the northern hemisphere and to the left in the southern hemisphere. Coriolis is a turning force.
Friction
We have one more force to consider and it affects only a shallow layer of wind near the surface: the Friction Force. The surface acts as a brake to air movement; it slows it down. This "braking" counteracts the Coriolis deflection somewhat. It is worth mentioning that the surface friction force does not affect winds in the upper atmosphere. It is also worth mentioning that turbulence caused by friction can bring higher speed wind downward and cause wind gusts at the surface. Friction is a slowing force.
The pressure gradient, Coriolis and friction forces together determine the wind direction and speed of the surface wind. We examine the wind resulting from these forces in the next section.
 |
 |
 |
 |
 |
 |
|
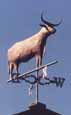
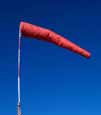
The creative design of weather vanes, which indicate wind direction, is an old, old art, dating back at least 1200 years on church steeples, for example. A few are shown here, starting with the classic chicken. Sailing and nature themes are common, but unique designs can be eye catching, such as the pterodactyl and bull. At the right is the reliable wind sock found at airports and landing strips. |
|||||