THE NATURAL ENVIRONMENT
Geography 101
ToC
CLOUDS
Evap
Humidity
Stability
Condense
Clouds
Humidity
 Humidity
is a general term for water in the atmosphere. It varies
continuously from place to place, with altitude, and over time. On average, 0 to 6% of the air is water vapor molecules, depending on time and place.
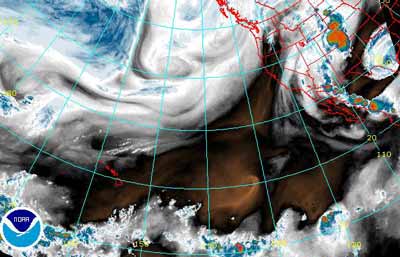
Consider the NOAA water vapor image of the north Pacific (dark is dry, white is moist, red/blue indicates widespread rainfall). The image shows huge variability in humidly over the area and identifies some major features of the global climate. The white humid band with rain near the equator (bottom) is the wet Intertropical Convergence Zone. Subtropical High pressure produces the dark, dry area in the middle. The humid white spirals to north are midlatitude low pressure centers spinning in the westerly winds, carrying cool air and precipitation to North America's west coast. The white oval shape at the top right is hurricane Claudette (July 15, 2003) headed for the Texas coast.
|
|
BOX 1 |
Vapor Pressure
 One
of the simplest and most widely used measures of water in the atmosphere
is vapor pressure (VP). It refers to the atmospheric
pressure exerted by water vapor molecules. For example, typically in
Hawai'i, this value
might be 25 millibars
(mb). If the overall atmospheric pressure is 1015 mb, then 25 mb
is due to water vapor and 990 mb is due to the other atmospheric gases.
The amount of water vapor in the
air varies from less than 1 mb up to about 70 mb for different places
around the globe.
Unlike other gases in Earth's atmosphere, water vapor concentration is limited by temperature. The maximum amount of water vapor that the air can hold is called the saturation vapor pressure (SVP), which varies with temperature as shown below. Note that: the warmer the air, the more water vapor it can hold.
|
 |
||||||||||||||||||||||
The relationship between Saturation Vapor Pressure (millibars) and Temperature (°C) given in graphic and tabular form. |
|||||||||||||||||||||||
Relative Humidity
The most widely reported measure of water in the atmosphere is relative humidity (RH). It is also, perhaps, the least understood. A simple formula for calculating relative humidity is: (NOTE: / means divide, * means multiply)
RH = VP / SVP *100
The key word is "relative." Vapor pressure gives you the absolute measure of how much water is in the atmosphere, regardless of air temperature. Relative humidity gives you the amount of water relative to the maximum amount air can hold (the SVP), which varies with temperature as shown above. This concept is simpler than it seems. Try a few simple calculations using the table below to guide you. Find the SVP values using the table above, and then calculate the relative humidity.
|
Relative Humidity (RH in %) |
Vapor Pressure (VP in mb) |
Saturation Vapor Pressure (SVP in mb) |
Air Temperature (°C) |
|
1 |
50% |
12 |
24 |
20 |
2 |
75% |
18 |
24 |
20 |
3 |
100% |
24 |
24 |
20 |
4 |
83% |
10 |
12 |
10 |
5 |
|
7 |
12 |
10 |
6 |
|
4 |
|
10 |
7 |
|
12 |
|
30 |
8 |
|
32 |
|
30 |
9 |
|
9 |
|
5 |
Study your completed table for a moment and think about what relative humidity means. For example, compare examples 1 and 4. Which has the most water in the air (highest VP)? Which has the highest relative humidity? (highest RH). The answers are not the same; be sure you understand why.
 Relative
humidity, then, depends on both the amount of water in the air and air
temperature. If temperature increases, SPV
increases, and relative humidity decreases. If the amount
of water vapor increases and temperature remains
the same, then relative humidity
also increases.
Compare
some of the values in your completed table to verify these statements.
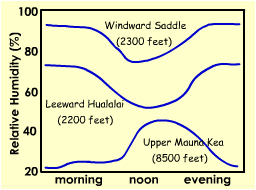
The graph shows how relative humidity changes throughout the day using data from three sites on the Big Island. At the windward Saddle Road and leeward Hualalai sites, the relative humidity is lowest during the daytime, and highest at night. While at first this seems counterintuitive, if you reflect on your own experience, it will make sense. When does dew form? Dew forms at night, when relative humidity at the surface increases to 100%, but seldom during daytime when relative humidity is lower.
|
|
BOX 2 |
Can you guess why the leeward site on Hualalai volcano has lower humidity values than the windward Saddle site? There are only two possible answers: either the leeward side has less water vapor in the air (lower VP) or it has higher air temperature (and thus, higher SVP). In this case, higher air temperature at the dry leeward location explains the lower relative humidity; water vapor in the air is about the same.
The Mauna Kea site is quite interesting; it shows a rare opposite pattern with higher humidity in the daytime. Can you guess why? Again, there are only two possible answers: either there is a daytime increase in VP or a daytime decrease in temperature (and thus, lower SPV). Since it is definitely not cooler during the daytime, the answer has to be: more water vapor. This strange humidity cycle reversal happens when a daytime sea breeze brings thin layer of moist air off the ocean to the upper mountain slopes. At nighttime, the land breeze reverses the wind direction and drier air is restored.
Just remember that relative humidity will change if either the air temperature changes or the amount of water vapor in the air changes.
Dew Point
 When air cools, saturation vapor pressure decreases as shown in the graph and yellow table above. If air cools
to the point where SVP equals VP, then relative
humidity becomes 100% and water condenses to form clouds, fog, and dew. This
temperature is called the dew
point. In example 3 of the table above, notice that VP and SVP are identical (24 mb) and the relative
humidity 100%.
The dew point temperature, then, for this example, is 20 °C, same as the air temperature.
To determine the dew point for other scenarios, simply look up the temperature using VP instead of SVP in the yellow SVP vs. Temperature table. For example 1, the dew point is 10 °C because VP is 12 mb. For example 2, dew point is about 21 °C because VP is 18 mb. See if you can figure out the dew point for some of the other examples; it's easier that it might appear, simply use the VP instead of SVP in the yellow table. By setting VP equal to SVP, you are creating a scenario in which the relative humidity is 100%, the criterion for the dew point temperature.
Dew point is also a way of reporting atmospheric water content, although not as commonly reported as relative humidity. If the dew point is high, then the amount of water in the air is also high. If you hear a weatherperson saying, "the dew point is declining," then you know that the amount of water in the air (VP) is also declining.
 |
Elementary,
my dear Watson. Of course! Humidity is relative. Cooling air
forms dew! |